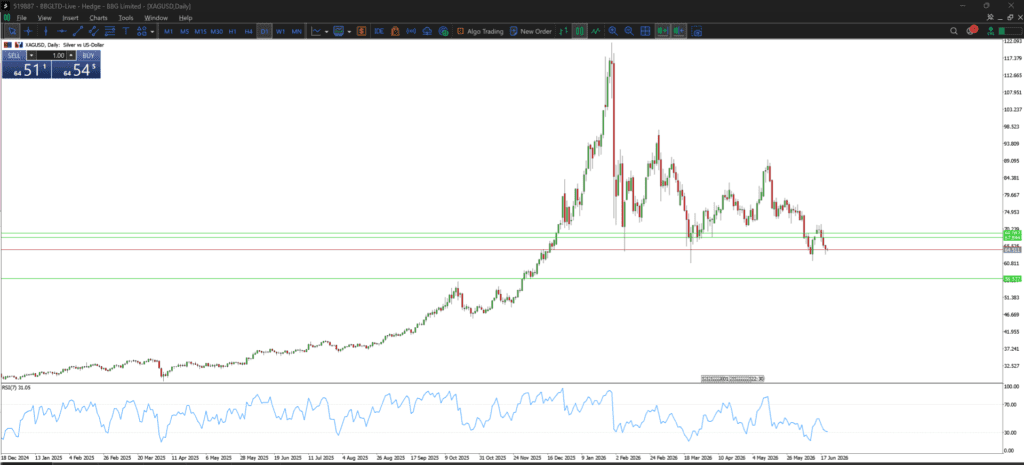
Silver prices have pulled back sharply from their 2026 peak near $122/oz (reached in late January), as shown in the attached daily chart. The chart captures a classic parabolic rally through late 2025 into early 2026, followed by a steep decline with multiple red candles, testing horizontal support levels around $65–70 before the latest leg down.
As of late June 2026, silver trades near $64.80–65.05/oz, down significantly from its all-time high.
What Drove the Massive Run-Up?
Silver’s surge was fueled by a potent mix of:
- Explosive industrial demand – especially solar PV (photovoltaics), EVs, electronics, and AI/data centers. Industrial use accounts for ~60% of total silver demand, with solar alone consuming hundreds of millions of ounces annually.
- Investment buying amid macroeconomic uncertainty, debt concerns, and gold’s parallel rally.
- Structural deficits – the silver market has seen multi-year shortfalls as mine supply (often a copper/zinc byproduct) lags behind consumption.
This pushed prices dramatically higher throughout 2025 and into early 2026.
Why the Sharp Reversal and Path Toward $56?
Recent price action reflects shifting demand dynamics and macro headwinds:
- India’s Import Restrictions (Major Demand Shock)
India, the world’s largest silver consumer (importing ~18–20% of global supply in recent years), imposed heavy curbs in mid-May 2026. High-purity silver bars moved to the “restricted” category (requiring licenses), duties rose sharply (to ~15%), and imports plummeted ~87% in May. While domestic premiums may rise, global demand has softened as India’s buying slows. This removes a key bid from the market. - Stronger US Dollar & Hawkish Fed
Rising interest-rate expectations, a stronger dollar, and profit-taking after the parabolic move have weighed heavily on non-yielding assets like silver. - Thrifting, Substitution & Demand Moderation
High prices accelerate efficiency gains (e.g., less silver paste per solar cell) and substitution in some applications. Some forecasts note potential deficit shrinkage in 2026 if industrial offtake cools.
Technical Outlook from the Chart:
The price has broken below key moving averages and horizontal supports visible in the image (around the $70 green line area). A sustained move below current levels could target the next major support zone near $56–58, aligning with prior consolidation areas and Fibonacci retracement levels from the broader uptrend. RSI is not deeply oversold, leaving room for further downside momentum in the near term.
Bullish Counterpoints (Why Not a Straight Crash?)
- Long-term fundamentals remain strong: green energy transition (solar + EVs), AI infrastructure, and persistent deficits should support prices over years.
- Any easing of India restrictions, dollar weakness, or renewed investment flows could spark sharp rebounds.
- Many analysts still see higher averages for 2026 overall, though near-term volatility is elevated.
Bottom Line
Silver’s run to $65+ (from much lower levels) was impressive but possibly overextended. India’s policy shift has altered demand dynamics in the short-to-medium term, opening the door for a deeper correction toward the $56 zone – a level that would represent a healthy (if painful) reset. Traders should watch US dollar strength, Fed signals, and any updates from Indian authorities. Long-term bulls see this as a buying opportunity in an industrial metal critical to the future, while near-term bears have the momentum.
Always manage risk — silver remains highly volatile.
If you’re interested in XAG/USD or our new Silver Gram instruments (GAG/USD), I’d love to hear from you. Reach out if you’re thinking about hedging strategies or just want to chat markets – my email is a.lal@blackbull.com.
From the desk of AL
Trading involves risk and may not be suitable for all investors. The information provided in this article is for educational purposes only and does not constitute financial advice. Always conduct thorough research and seek professional advice before making any investment decisions.